

Ever wondered how tiny company pieces can lead to big profits? The stock market is like a bustling market where each share acts as your ticket to own a small piece of a business. Buying stocks is kind of like getting a slice of a giant pie, with every slice holding a chance for growth.
Numbers and simple details play a big role behind the scenes, steering major financial decisions and powering smart investing. Today, we'll break down how these basic elements come together, turning the stock market into a strong tool for growing your wealth.
Understanding Financial Stock Markets Fundamentals
Imagine a busy marketplace, but instead of fruits and clothes, companies sell small pieces of themselves. In these stock markets, shares are like little tickets that show you own part of a company. Companies sell these shares to gather cash for new projects or to keep their business running smoothly. For instance, if a company sells one million shares at $10 each, it earns about $10 million before fees. That money can help spark growth or fuel innovation. Investors join in too, hoping to earn money and be part of a company’s future.
There are many players in this market. You’ll find brokers, dealers, market makers, and both individual and big institutional investors. Each one helps make the market tick. Day-to-day trading is guided by basic facts like a company’s sales and job numbers, along with a peek at global market trends. The push and pull of supply and demand ends up setting the share price. In other words, the price tells us both where a company stands today and what its future might hold.
Simple details such as trading volume and bid-ask spreads help us understand how eager investors are. Think of these details as clues about the market's mood and the ease with which shares change hands. Whether changes are fast or slow, every move in the market plays a role in making smart investment decisions. It’s this natural rhythm that shows just how important stock markets are in the world of finance.
Historical Evolution of Stock Markets
The story of stock markets begins in the mid-1500s in Antwerp, where merchants traded goods and even shared a piece of their profits. Back then, people swapped items or rights instead of money, setting the stage for early investments. Then, in 1602, the East India Company came up with a clever idea: selling small parts of a ship so that many folks could invest just a little in a big venture. Picture a merchant saying, "Take a share of our ship, be part of the journey!" This simple twist opened up the world of investing for many.
Jump to 1773, and you'll find the London Stock Exchange opening its doors. This marked a shift to more organized trading, where companies began listing their shares in a regulated space. Having fixed rules in play made investing feel safer, much like learning to play a game with clear instructions.
In 1792, the New York Stock Exchange got started with strict rules on who could join. Only companies meeting high standards were allowed, which built trust for those buying and selling shares. These early practices paved the way for the investor protections we enjoy today.
Looking back, these key moments show how simple trading methods grew into the regulated markets we rely on now. It’s a reminder that smart investing started with basic ideas that evolved into the structured systems we trust today.
Market Structure in Financial Stock Exchanges
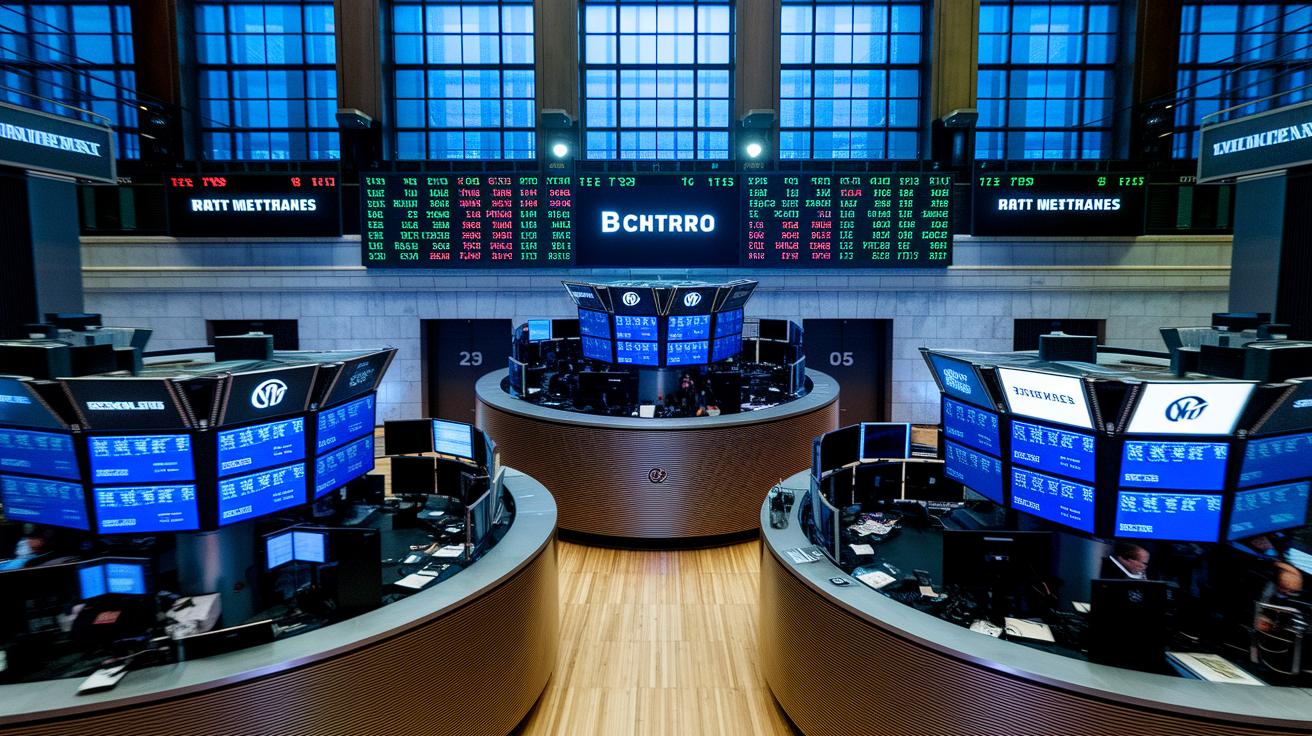
Modern trading hubs like the NYSE, NASDAQ, and over-the-counter markets form the backbone of smart investing. These busy centers are where shares and other financial instruments change hands quickly and securely. Ever wonder how millions of shares can trade in a single day? It shows just how efficient these trading floors really are.
Brokers, dealers, and market makers all have their parts to play. Brokers help connect buyers and sellers. Dealers sometimes dip into their own inventories to keep trades moving smoothly. And market makers? They’re like friendly guides ready with quotes to bridge gaps between buyers and sellers. Imagine a lively bazaar where everyone relies on swift, clear pricing.
Understanding liquidity is key here. Tools like average daily volume and bid-ask spreads help explain market dynamics. For instance, a narrow bid-ask spread means a stock is actively traded, so you can buy or sell with little fuss over price swings. Picture it like a popular toy on a busy shelf that sells out fast!
The U.S. Securities and Exchange Commission, or SEC, keeps a close watch over these markets. Their regular oversight ensures fair play and helps prevent fraud. This monitoring gives investors peace of mind, fueling smart investing with strong safeguards in place.
Key Stock Market Indices Overview

Stock market indices are like baskets full of stocks that give you a quick peek at how a market is doing. They gather well-known companies into one group so you can see trends without too much fuss. Think of the S&P 500 as a snapshot of the biggest U.S. companies, it shows you how major sectors are doing.
The Dow Jones Industrial Average is another key index. It watches 30 well-known companies to give investors a feel for the market's pulse. Then there's the NASDAQ Composite, which is more focused on tech companies, signaling shifts in the tech world when it moves up or down. In simple terms, when these indices change, they hint at how investors feel about different parts of the market.
Investors often use financial tools like futures and options based on these indices. Picture it like a runner glancing at the scoreboard during a game. The index tells you at a glance whether the market feels strong or needs a boost.
| Index | Main Focus |
|---|---|
| S&P 500 | Large U.S. companies |
| Dow Jones | 30 blue-chip companies |
| NASDAQ Composite | Technology and growth stocks |
Trading Mechanisms and Market Hours
Stock markets don’t shut down strictly at 4:00 p.m. ET. While the main trading window runs from 9:30 a.m. to 4:00 p.m. ET, a time when most trades are made and prices come alive, investors still have opportunities outside these hours. You can trade before the regular session during pre-market hours or afterwards in the post-market. These extra sessions can hint at what the market might do when the official day begins.
Modern trading has been transformed by algorithmic and high-speed systems that execute orders in split seconds. Imagine a computer reacting almost instantly when news breaks or fresh data comes in; that’s the reality today. This rapid-fire action helps tighten the spread between buying and selling prices, and clues for the next day start to emerge during these off-peak times.
When the clock hits 4:00 p.m. ET, that closing bell isn’t just a routine signal, it locks in the final prices for the day. These last trades set the stage for tomorrow’s opening numbers. In short, knowing how both regular and extended trading hours work can really boost your investing strategy.
Market Analytics and Technical Tools

Chart types such as candlestick and line charts lie at the heart of market analysis. Think of a candlestick chart as a little story where every candle shows the day’s opening, closing, high, and low prices. This detail helps investors feel the market’s mood right away.
Moving averages, whether simple or exponential, work like a gentle filter that smooths out everyday price noise. They let you see the true trend, much like a soft wave guiding your view over time. And then there are patterns, like head-and-shoulders and triangles, which hint at possible price reversals. Picture a head-and-shoulders pattern as a friendly alert that a stock might soon change direction.
Another handy tool is the Relative Strength Index (RSI). It measures how quickly and how much prices change, kind of like a traffic light indicating when a stock might be too high or too low. Meanwhile, volume analysis shows you how many shares are traded, confirming if a breakout is strong. Breakout signals act as signs that a stock has crossed key resistance levels, suggesting a good moment to enter or exit a position.
Some traders use automated strategy tools like the performance metrics for algorithmic investing to check these signals. Others dive deeper by exploring what is technical analysis for charting basics. By blending these tools together, smart investors gain the clear, real-time insight they need to make well-informed decisions.
Fundamental Research in Stock Markets
Fundamental research is like checking a company's report card. It means looking at a company’s financial health by reviewing its financial statements, its performance in the market, and the overall economic climate. Investors often check numbers such as market capitalization (which is just a measure of the company's size), earnings per share (that shows profit per share), and ratios like P/E and P/B to see if the stock’s price makes sense. For instance, a company with a low P/E ratio and steady earnings growth might be a smart pick.
Every time companies release their quarterly numbers, lots of details come to light. During those periods, many companies even beat expectations, which floods the market with fresh information about revenue, costs, and profit margins. Imagine it like receiving a detailed report card, you get a clear look at how well the company is doing and how efficiently it turns sales into profit.
Dividend analysis also plays a big role in fundamental research. For investors looking for steady cash flow, dividend yields are key. Reliable dividend payments can show that a company is strong and dedicated to rewarding its shareholders. Meanwhile, those focusing on growth might prefer to see profits being reinvested to fuel rapid expansion. This contrast highlights how some investors lean on value strategies with steady dividends, while others chase quick earnings growth.
Managing Risk and Volatility in Stock Markets

Navigating the stock market can feel like being on a roller coaster, one minute you're riding high, and the next you're holding on tight. In a bull market, prices usually rise, giving you that boost of optimism. But in a bear market, falling prices can put you on edge and prompt a more cautious approach. This ever-changing landscape creates both risks and opportunities for those who keep their eyes open.
Volatility indexes, like the VIX, act like a simple gauge of market mood. When you see the VIX spike, it's almost as if investors are pausing, bracing for a big price swing. This kind of signal tells you when nervous energy is building up, suggesting that it might be time to tighten your risk controls a bit.
Support and resistance levels are like invisible boundaries that guide smart decisions. Support works as a price floor, while resistance acts like a ceiling where selling pressure typically gathers. When you notice a sudden burst of trading activity at these points, it could mean the market is shifting, kind of like spotting a key move in a tightly contested game.
Short-selling offers another approach during choppy markets. It means profiting from falling prices by betting against a stock, but it definitely calls for sharp analysis and careful management of risk. Meanwhile, liquidity ratios measure how quickly your investments can be turned into cash when you need it. Together, these tools help ensure you're not caught off guard when the market makes its next move.
Understanding these techniques empowers you to better gauge market risks and act wisely when volatility strikes.
Regulatory Framework Governing Stock Markets
The U.S. Securities and Exchange Commission, or SEC, acts like a friendly watchdog ensuring that trading stays fair and honest. They keep a close eye on how stocks are bought and sold and make sure that any signs of fraud are swiftly handled. In doing so, they review company announcements and scrutinize trading patterns so that everyone has a fair shot at success.
Sometimes the market experiences wild swings, and that’s when circuit breakers jump in. These safety stops temporarily pause trading when prices change too drastically, giving investors a moment to process new info and rethink their choices. This short break helps keep rash decisions at bay and supports steadier market behavior during uncertain times.
By setting up and enforcing these rules, regulators help create an orderly playing field for everyone. This not only protects individual investors but also keeps the market stable when things get bumpy. Investors can feel more secure knowing there are measures in place to halt erratic trading and ensure prices reflect true market value. It’s like having a reliable safety net that fosters an environment where smart, confident investing can really take off.
Investment Strategies and Portfolio Management

Building a diversified portfolio is the smart way to invest. When you mix different types of assets like stocks and bonds, you create a safety net that can help cushion you during market ups and downs. It’s like giving your money a little extra protection when things get bumpy.
One key step is to rebalance your portfolio. Think of it as a regular check-up for your investments. As the market changes, the value of your assets shifts, and rebalancing means you adjust your holdings so they continue to match your financial goals, even when the market feels uneasy.
Many seasoned investors stick to proven tactics. For example, dollar-cost averaging lets you buy more shares when prices are low and fewer when they’re high. Sector rotation means you shift your investments between different industries as trends change. And using trailing stops helps protect your gains while still leaving room for growth. Fun fact: many top investors treat regular rebalancing like a health check for their portfolios!
Risk control isn’t just about stopping losses; it also keeps your asset mix balanced. By checking your portfolio often, you can see when it’s time to tighten up your risk measures. Here’s a simple plan you can follow:
| Step | Action |
|---|---|
| 1 | Review your asset mix every few months |
| 2 | Stick to strategies that match your comfort with risk |
| 3 | Use dollar-cost averaging to ease the impact of market swings |
| 4 | Rebalance your portfolio periodically based on performance |
By breaking your strategy into clear steps, you spread out potential risks. A steady, predictable routine can boost your confidence. Even during uncertain times, having clear targets for your asset mix helps you stay invested and ready to take advantage of growth opportunities.
Market News and Updates for Stock Investors
In July, the Federal Open Market Committee decided to keep the fed funds rate unchanged at 4.25% to 4.5%. Two members even voted to lower the rate because they’re worried the economy might be slowing down. This choice has left many investors feeling cautious.
Rising U.S. tariffs are also catching the eye. Tariff levels now range from 10% to 41%, with an average near 18.3%, a scene we haven’t seen since the early 1930s. Meanwhile, a softer August jobs report hints that the labor market could be cooling, prompting many to take a closer look.
Moreover, the S&P 500 has rallied more than 20% since its April lows, setting an energetic stage for this earnings season. Investors are advised to keep their portfolios diverse and stay updated on Q2 earnings and short-term market moves through reliable news sources.
Global Comparisons of Financial Stock Markets

Across the globe, stock markets run on different schedules and systems, which can really change how and when you decide to invest. In the United States, big exchanges like the NYSE and NASDAQ are famous for their long trading hours and solid rules that help protect your money. Over in London, the market follows a schedule shaped by European standards and a focus on more traditional industries. In Tokyo, the market pulses with an energy tied to industrial production and local consumer habits. Meanwhile, Hong Kong mixes Eastern and Western influences, setting up rules that make it a gateway for money moving through Asia.
These variations make a big difference when you strategize on a global scale. For instance, think about trading hours: while U.S. markets kick off later in the morning, Tokyo’s market starts even earlier compared to Greenwich Mean Time. This can mean that one market reacts to global news while another is still catching some sleep. Also, each region tends to favor different sectors, tech and healthcare lead in the U.S., while financial services and local industries often shine in London or Hong Kong.
This worldwide connection invites you to consider trends that cross borders. By noticing these key differences, you can pick up on clues about how money flows around the world and make smarter decisions about where to put your investments.
Final Words
In the action of our deep dive into financial stock markets, we uncovered how public exchanges work, traced historical milestones that shaped modern trading, and clarified the roles of market participants and technical tools. We also examined the risks, regulatory safeguards, and portfolio strategies that guide smart investing.
Each element contributes to a clearer picture of how financial stock markets drive investment decisions. The analysis paints a hopeful future for individuals ready to make informed, strategic choices.
FAQ
What is the current state of financial stock markets today and how can I view live charts?
The current state of the stock market is shown in real time through live charts that display pricing, volume, and trends from various exchanges. Investors can check these charts for up-to-date market activity.
What are the 4 financial markets?
The 4 main financial markets include the stock (equity) market, bond market, commodities market, and foreign exchange market. Each market handles different assets to support growth and stability.
What is the 7% rule in stocks?
The 7% rule in stocks often refers to the historical average annual return of around 7% over long periods, giving investors a rough benchmark for potential growth when planning their portfolios.
Should a 70-year-old get out of the stock market?
The idea of stepping away entirely is not set in stone for a 70-year-old. Adjusting the portfolio toward more stable or income-driven investments may better suit changing financial needs and risk tolerance.
How do major networks like CNN, Fox News, CNBC, MSNBC, NBC News, and BBC cover stock market updates?
Major networks present stock market updates with live charts and clear explanations, offering viewers analysis, current market trends, and key economic indicators to help keep everyone informed.